
Risk management of VP Bank Group
1. Overview
Effective risk, liquidity and capital management is a fundamental prerequisite to the success and stability of a bank. VP Bank understands this term to mean the systematic processes to identify, evaluate, manage and monitor the relevant risks as well as the steering of the capital resources and liquidity necessary to assume risks and guarantee risk tolerance. The risk policy which has been laid down by the Board of Directors of VP Bank Group constitutes the mandatory operating framework in this respect.
It contains an overarching framework as well as a risk strategy for each risk group (financial risks, operational risks, business risks). Described and clearly regulated therein are the specific goals and principles, organisational structures and processes, methods and instruments as well as target measures and limits.
On 1 February 2015, the CRD IV package became law in Liechtenstein (Basel III). As a locally system-relevant institution, VP Bank must possess equity amounting to at least 13 per cent of its risk-weighted assets. As of 1 January 2018, the leverage ratio (maximum indebtedness ratio) must not fall below the regulatory limit of 3 per cent. On the liquidity side, compliance with a regulatory ratio (liquidity coverage ratio / LCR) of at least 70 per cent as of 31 December 2016 resp. 80 per cent as of 1 January 2017 is required. Thanks to its eminently robust equity basis, its balance-sheet structure and its comfortable liquidity situation, VP Bank has at all times markedly over-fulfilled the 2016 regulatory limits.
In addition to quantitative measures, Basel III imposes a range of qualitative requirements as regards the identification, measurement, steering and monitoring of financial and operational risks. These had been implemented by VP Bank for the most part during the 2015 business year.
Capital and balance-sheet structure management
The minimum capital ratio of VP Bank of 13 per cent of risk-weighted assets comprises the regulatory minimum requirement of 8 per cent as well as a capital conservation and systemic risk buffer each of 2.5 per cent. Furthermore, Basel III provides for an anti-cyclical capital buffer which was set at 0 per cent by the FMA for 2016.
Thanks to an exceedingly robust tier-1 ratio of 27.1 per cent as of the end of 2016, it continues to guarantee sufficient freedom of action. This enables VP Bank to continue to assume risks associated with the conduct of banking operations. At the same time, there remains potential for corporate acquisitions through free equity resources, even after covering all risks.
The Leverage Ratio of VP Bank amounted to 7.8 per cent at the end of 2016. The regulatory minimum ratio of 3 per cent as of 1 January 2018 is thus observed. VP Bank must publish its degree of indebtedness since 2015 within the scope of a pillar 3 disclosure.
As part of equity and balance-sheet-structure management, compliance with regulatory requirements and the obser- vance of the requirements deriving from its business needs is monitored on an on-going basis. Using an internal process to assess the adequacy of capital resources (Internal Capital Adequacy Assessment Process), the possible adverse effect on the equity basis in stress situations are simulated and analysed.
Liquidity management
The relevant standards for VP Bank under Basel III are derived from in the Capital Requirements Regulation (CRR). This requires compliance with a Liquidity Coverage Ratio (LCR) for short-term liquidity. As of the end of 2016, a minimum ratio of 70 per cent applies on a European level. Thanks to a comfortable liquidity situation, this target can be achieved with a value of 110 per cent.
The maintenance of liquidity at all times within VP Bank Group continues to have the highest priority. This is assured with a large balance of cash and cash equivalents and high quality liquid assets (HQLA).
In future, in the area of liquidity, a so-called Net Stable Funding Ratio (NSFR) will need to be complied with, in addition to the Liquidity Coverage Ratio. It dictates the structural liquidity of credit institutions whereby a time horizon of one year is considered and is designed to ensure matched financing on a long-term basis. As of the end of 2016, concrete details as of the manner in which it is to be structured in Liechtenstein are not yet available, so that no assertions can yet be made as to compliance with the future required ratio by VP Bank.
In future, liquidity requirements will be further developed on a European level. Additional parameters to monitor liquidity are planned (additional liquidity monitoring metrics), as well as a plan of refinancing (funding plans) and a process to ensure appropriate liquidity (internal liquidity adequacy assessment process).
On the basis of the qualitative requirements of Basel III in Liechtenstein, VP Bank has drawn up and implemented an emergency liquidity plan. This plan serves, inter alia, to monitor early-warning indicators which could point to a possible future deterioration in the liquidity situation.
As part of liquidity management, compliance with regulatory requirements and the fulfilment of business needs is subjected to on-going monitoring. Using stress tests, possible adverse scenarios are simulated and the impact on liquidity in stress situations analysed.
Credit risks
Because of the importance of the client lending business (CHF 5.2 billion as of 31.12.2016), the management and monitoring of credit risks continues to play a central role. In 2016, the volume of client loans increased by CHF 0.2 billion to CHF 5.2 billion. In the interbank business, the volumes in 2016 fell by CHF 1.4 billion to CHF 0.7 billion at the end of the year.
Market risks
The interest-rate environment in the Swiss franc and in the Euro in 2016 was characterised by negative interest rates for short-term maturities. The negative interest-rate environment in both principal currencies presents balance-sheet management with major challenges. The investment of client deposits continues to present difficulties. VP Bank has continued to pursue the measures it took as a reaction to the abandonment of the minimum exchange-rate policy to the Euro and the shift into negative territory of the target band by the SNB. Because of its comfortable liquidity and equity situation, the risk tolerance of the Bank was assured at all times even after the SNB decision. The monitoring and management of market risks remains of central importance in 2017.
Operational risks
The systematic management of operational risks was further continuously developed in VP Bank in 2016. The focus of efforts in this respect was the conduct of risk assessments in the parent bank and in Group subsidiaries as well as the further consolidation and optimisation of the existing internal control system (ICS).
2. Principles underlying the risk policy
Risk management is predicated on the following principles:
Alignment of risk tolerance and risk tolerance
Risk tolerance is reflected in the risk capital and indicates the maximum loss which the bank is prepared to bear arising from crystallising risks without thereby jeopardising the bank’s ability to continue as a going concern. As a strategic success factor, risk tolerance is to be maintained and enhanced by employing a suitable process to ensure and increase an appropriate capital base.
Clear competencies and responsibilities
Risk tolerance is rendered operational with the aid of a comprehensive system of limits and implemented in an effective manner together with a clear set of guidelines governing the tasks, limits of authority and responsibility of all functions, organisational units and bodies participating in risk- and capital-management processes. If required, the risk coverage potential, risk capital and limits are reviewed at least once a year, and adjusted if necessary. The risk coverage potential results from net present value of equity, less operating and risk costs as well as regulatory capital-adequacy requirements.
Conscientious attitude to risks
Strategic and operational decisions are taken based on risk/return calculations and aligned with the interests of the stakeholders. Whilst complying with legal and regulatory provisions and the principles underlying business and ethical policies, VP Bank takes on risks consciously so long as the extent of these are known and the technical prerequisites to map them are at hand and that the bank is adequately rewarded. It avoids transactions with an unbalanced relationship of risks to returns as well as large risks and extreme risk concentrations which could jeopardise risk tolerance and thus the ability of the Group to continue as a going concern.
Segregation of functions
Risk control and risk reporting are assured by a unit (Group Risk) which is independent of those functions involved in the management of risks.
Transparency
The underlying principle of risk monitoring is a comprehensive, objective, timely and transparent disclosure of risks to Group Executive Management and the Board of Directors.
3. Organisation of capital, liquidity and risk management
Classification of banking risks
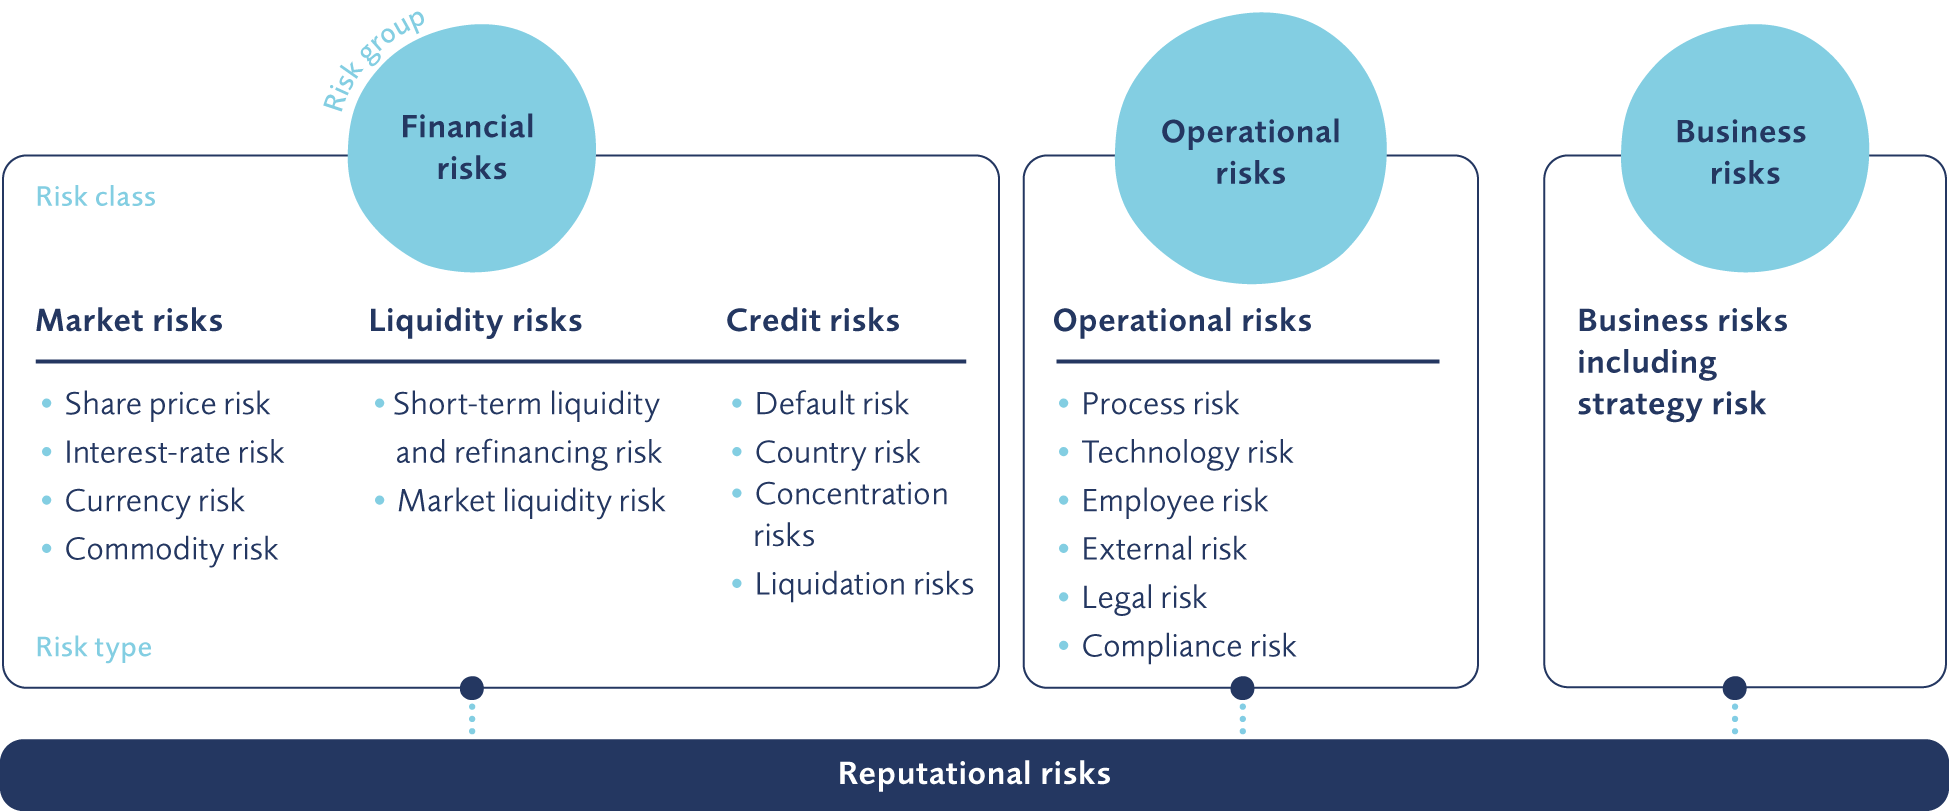
The following table gives an overview over the risks to which VP Bank is exposed in its ordinary course of business. These are allocated to three risk groups – financial risks, operational risks and business risks (including strategic risks).
Whilst financial risks are consciously entered into to generate revenues, operational risks are to be avoided through appropriate controls and measures or, if that is not possible, to be reduced to a level laid down by the bank.
Unlike business risks, financial and operational risks are the result of a bottom-up process in the risk management process of the bank. Measures designed to contain them are elaborated by the responsible functions, organisational units or committees and approved by the Board of Directors or Group Executive Management. Business risks, on the other hand, are analysed by the Board of Directors and Group Executive Management after considering the banking environment and the internal situation of the company. Company management derives top risk scenarios from the analysis and designs related measures, the implementation of which is delegated to the competent function or organisational unit (top-down process).
Market risks express the danger that possible economic losses in value in the banking and trading books will arise from adverse changes in market prices (interest rates, currency rates, equity share prices and commodity quotations) or other price-influencing parameters such as volatility.
Liquidity risks comprise liquidity and refinancing risks as well as market liquidity risk. Liquidity and refinancing risks express the danger that current and future payment obligations cannot be met on the due date or to the full extent. Market liquidity risk includes cases where it is not possible, as a result of insufficient market liquidity, to liquidate positions subject to risk on a timely basis and in the desired amount and on acceptable conditions.
Credit risks comprise both counterparty and country risk. Counterparty risks describe the danger of a financial loss which may arise if a counterparty of the bank cannot or does not wish to meet its contractual commitments in full or on the due date (default risk) or the credit-worthiness of the debtor has deteriorated (solvency risk). Country risks as a further extension of credit risk arise whenever political or economic conditions specific to a country diminish the value of an exposure abroad.
Operational risks represent the danger of incurring losses arising from the inappropriateness or failure of internal procedures, people or systems or as a result of external events.
Business risks, on the one hand, result from unexpected changes in market conditions and environment having a negative impact on profitability; on the other, they describe the danger of unexpected losses resulting from management decisions concerning the business policy orientation of the Group (strategic risks).
If the above-mentioned risks are not recognised, appropriately controlled, managed and monitored, this may lead – apart from financial losses – to reputation being damaged. VP Bank therefore considers reputational risk not to be a separate risk category but rather the danger of losses resulting from the individual types of risk of the other risk categories. Management of reputational risks is incumbent on Group Executive Management.
Duties, powers of authority and responsibilities
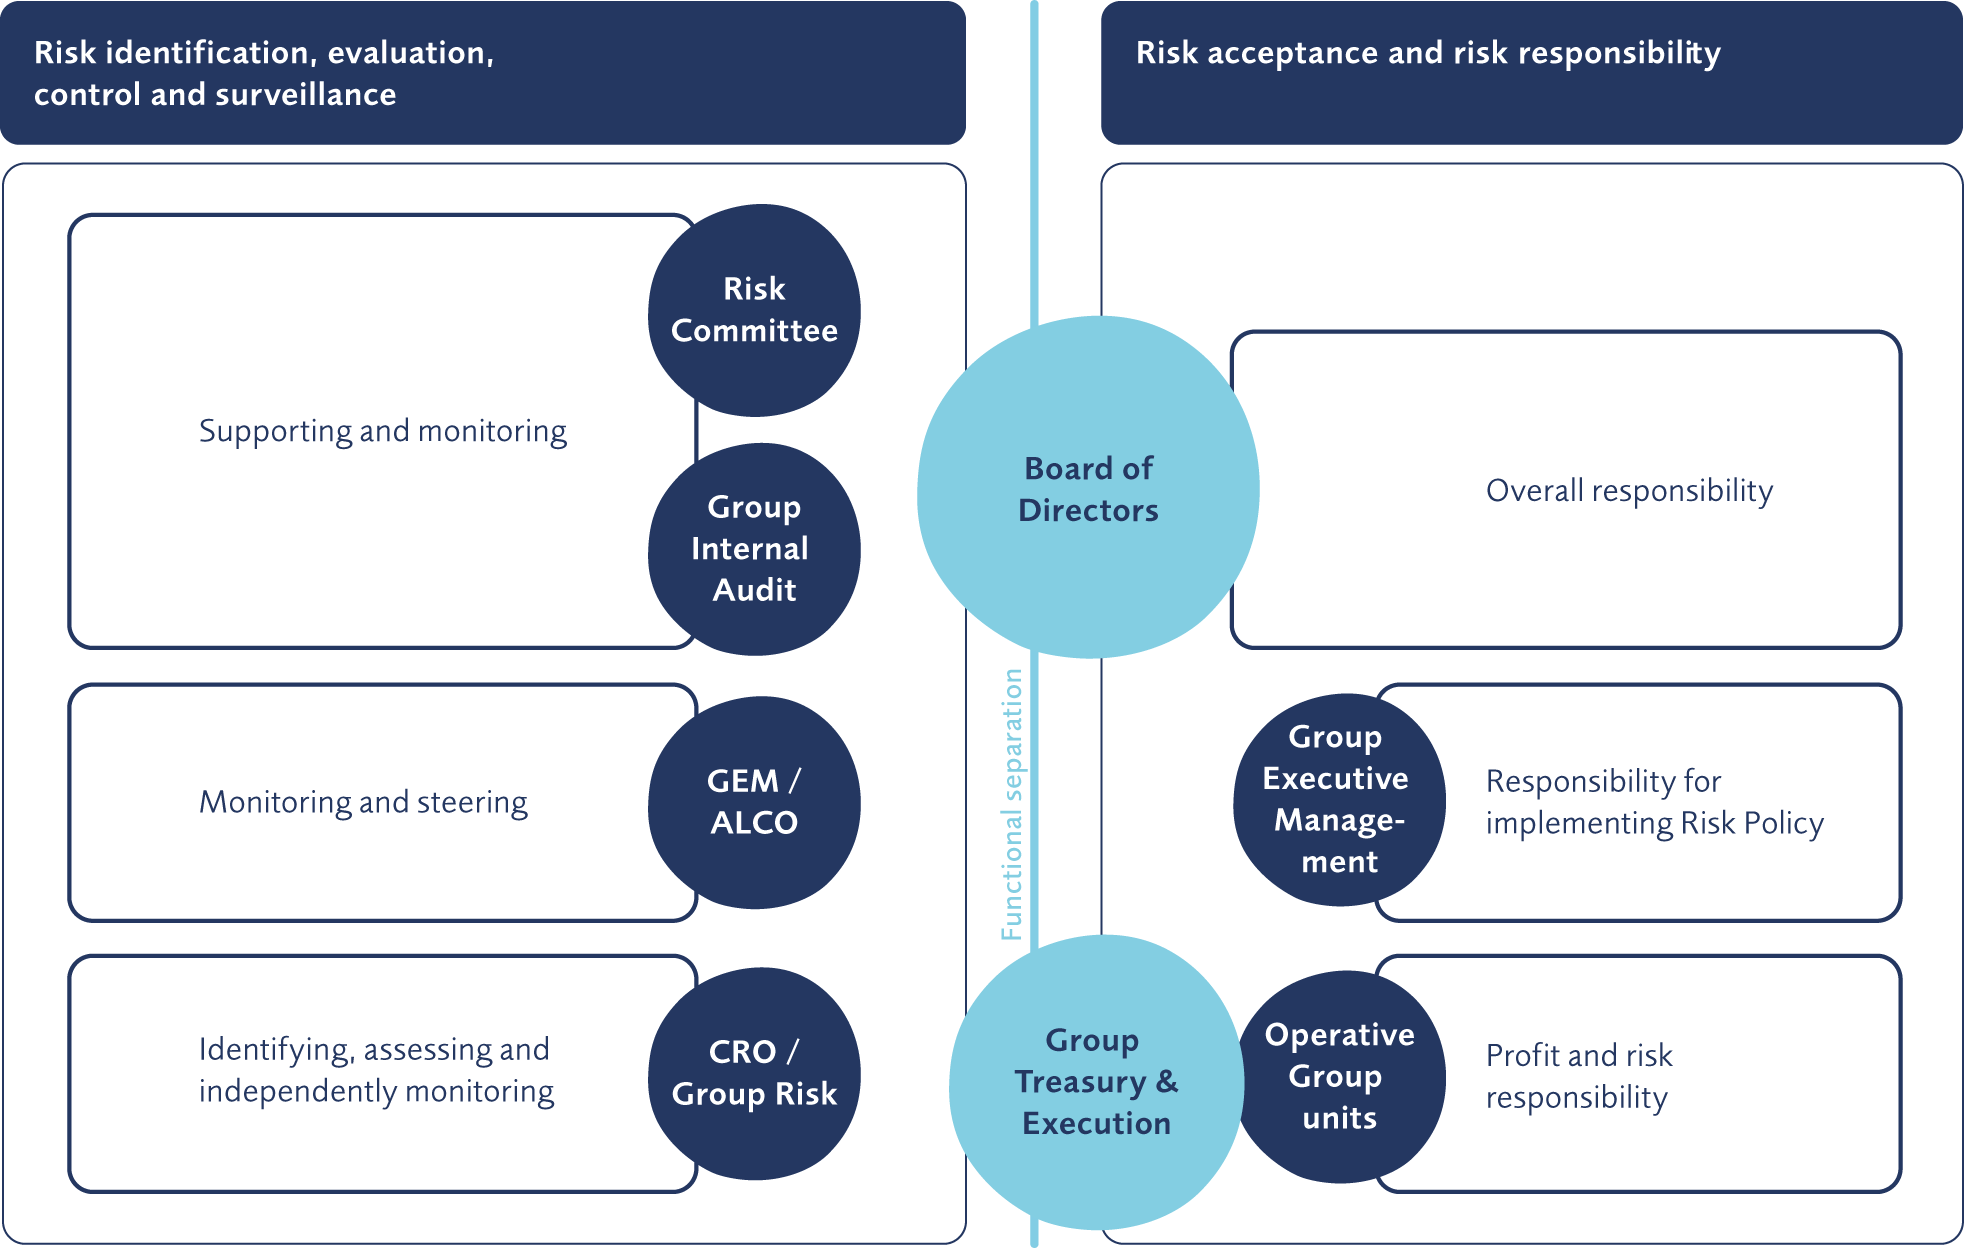
In relation to the organisation of capital, liquidity and risk management, the Basel III rules require that a risk-management function be in place with is segregated from the operational business areas. In accordance with the Liechtenstein Banking Ordinance currently in force, a member of the Executive Board shall head up the risk-management function (Chief Risk Officer) who specifically is responsible for this function. Insofar as no conflict of interest exists, another management member within the bank may assume this function. In VP Bank, the role of Chief Risk Officer will be embedded, from 2017 onwards, in the organisational unit “General Counsel & Chief Risk Officer” at the level of the Group Executive Management.
In addition to the CRO, a series of committees and operational units are involved in risk- and capital-management processes. The table above gives an overview in diagram form of the organisational structure in VP Bank.
The Board of Directors bears the ultimate responsibility for capital, liquidity and risk management within the Group. It is its remit to establish and maintain an appropriate structure of business processes and organisation as well as an internal control system (ICS) for an effective and efficient management of capital, liquidity and risk thereby ensuring the risk tolerance of the bank on a sustainable basis. The Board of Directors is responsible for approving the Risk Policy and monitoring its implementation, laying down the risk tolerance on a Group level and stipulating the target measures and limits for capital, liquidity and risk management. In assuming its duties, the Board of Directors is supported by the Audit Committee, the Risk Committee and Group Internal Audit.
The Group Executive Management is responsible for the implementation and observance of the Risk Policy. Amongst its core tasks are the allocation of the target measures and limits laid down by the Board of Directors to the individual Group companies, the Group-wide management of credit, market, liquidity, operational, business and reputational risks as well as capital-management activities.
As an independent function for the centralised identification, evaluation (measurement and assessment) and monitoring (control and reporting) of the risk situation and risk tolerance of the Group, the Chief Risk Officer supports the Board of Directors and Group Executive Management in assuming their respective duties. A task of Group Risk consists of ensuring that existing legal, regulatory and internal bank prescriptions in force in Liechtenstein are complied with and new prescriptions implemented. In addition thereto is the on-going review and assessment of the effectiveness and appropriateness of the methods, performance indicators and systems deployed in risk management.
Group Treasury & Execution bears the responsibility for the day-to-day management of financial risks within the target measures and limits laid down by the Board of Directors and Group Executive Management, whilst complying with legal and regulatory prescriptions. Part of its core tasks is balance-sheet structure management whilst taking account of the profitability, risks and equity situation of VP Bank as well as bank capital management, liquidity management, collateral management and the management of limits for banks and countries.
All risk-taking functions and organisational units belong to the operating units.
Process to ensure an appropriate capital base
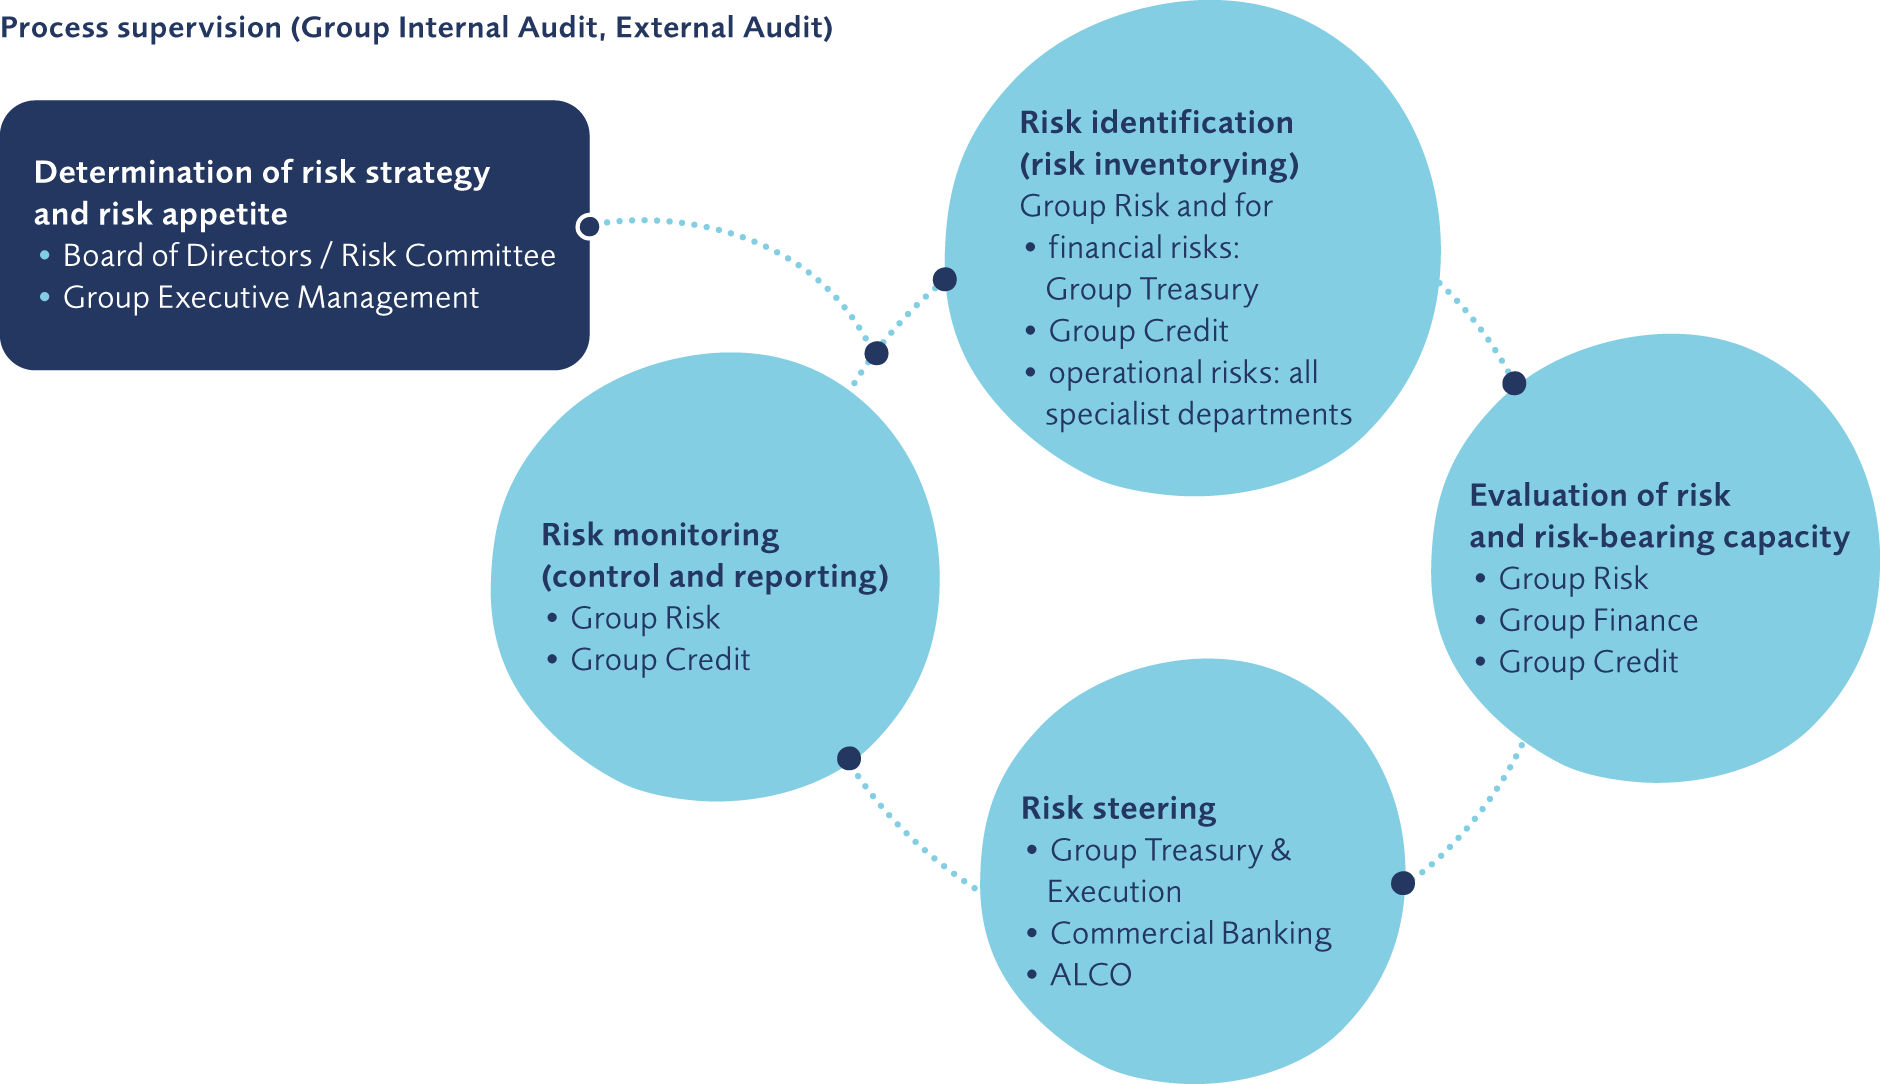
VP Bank Group employs the Internal Capital Adequacy Assessment Process (ICAAP) to ensure a capital base appropriate to the risk situation of VP Bank even in the event of adverse market developments and extreme events. It is briefly described below and presented in the following diagram:
The risk strategy and risk appetite which is derived from the global and individual limits is laid down during the annual planning process based on a risk tolerance analysis and taking into account stress scenarios, strategic initiatives and changes in regulatory directives on the part of the Board of Directors. The risk capital includes the regulatory capital required to support business activities and the economic capital for extreme unexpected losses arising from market, credit and operational risks. For the latter, the Board of Directors makes available only a part of the maximum available risk cover potential in the form of an overall bank limit. Accordingly, not all of the freely available equity (after deducting the regulatory required capital as well as funds planned for future capital expenditure) is made available; a portion thereof is retained rather as a risk buffer for unquantifiable or not fully identified risks. To ensure that VP Bank has always enough equity to cover all significant risks, a rolling three-year capital plan is prepared which takes into account differing high degrees of stress level.
The annual inventory of risks ensures that all risks of relevance to the Group are identified. In addition, an identification of risks is undertaken on a mandatory basis as part of the process of introducing new financial instruments, the assumption of activities in new fields of business or geographic markets as well as in the event of changes to legal or regulatory provisions.
Risk tolerance is determined on the basis of the extent to which the economic required capital is used up, measured by reference to the freely available equity of the bank less the risk buffer as laid down by the Board of Directors. In computing the economically required equity, the risks are aggregated to form an overall assessment whereby the value-at-risk method is employed for the financial risks. Operational risks are computed using the basis indicator approach. Over and above this, VP Bank resorts to a broad panoply of methods and indicators which are described in greater detail in the sections on the individual risk groups.
Day-to-day risk management is performed on a strategic level by setting goals, limits, principles of conduct as well as process guidelines. On an operating level, risk diversification is ensured by managing financial risks within the target measures and limits set as well by observing regulatory requirements.
Risk monitoring (control and reporting) encompasses control and reporting on the risk situation. An impetus for extended controls is given by any applicable exceeded limits highlighted during a regular target to actual performance comparison. The reference standard results from the internal target measures and limits set as well as legal and regulatory norms. In this respect, advance warning stages enable an early course of action in order to avoid exceeding limits. As part of reporting, the results of the review are set forth in a reliable, regular and transparent manner. Reporting is made ex ante to the preparation of decisions, ex post to control purposes as well as ad hoc in the case of suddenly and unexpectedly occurring risks.
In addition to the ICAAP report, VP Bank prepares a Group Recovery Plan for the attention of the Liechtenstein supervisory authorities. With the Bank Recovery and Resolution Law (BBRL), there now exists a corresponding legal basis in Liechtenstein as from 1 January 2017 onwards (cf. section on Legislation and Supervisory Authorities in Liechtenstein). The Recovery Plan shows various options of dealing with a corporate reorganisation which assist the bank in the event of a crisis to be able to continue to fulfil the requirements regarding capital adequacy and liquidity. The goal of each measure is to ensure or restore the financial solidity in a sustainable manner and thus guarantee the ability to continue as a going concern even in the event of a crisis. Taking precedence are measures which are already taken within the scope of current business operations and of the ICAAP report (including the three-year capital plan) in order to ensure the status as a going concern and comply with the capital-adequacy requirement. Should these measures remain ineffectual, the options of dealing with a corporate reorganisation of the Recovery Plan shall be implemented.
4. Disclosure on Basel capital-adequacy provisions
The required qualitative and quantitative information on capital adequacy, on the strategies and processes for risk management as well as on the risk situation of VP Bank are set forth in the commentary on the consolidated financial statements. Over and above this, VP Bank Group has drawn up a Disclosure Report for the 2016 business year. In this manner, the bank fulfils the supervisory requirements reflected in the amendments to the Banking Ordinance (BankO) and the Banking Act (BankA) which took effect on 1 February 2015 which are the result of transposing into local law the Directive 2013/36/EU (CRD IV) and Regulation (EU) No. 575/2013 (CRR), respectively.
The capital-adequacy and liquidity requirements for credit institutions in Liechtenstein are based on the European directives regarding Basel III rules. As one of the three system-relevant banks in Liechtenstein, VP Bank is to fulfil the requirement of additional buffers. Increased regulatory capital-adequacy requirements enhance the stability of the financial system and improve creditor protection.
The Basel III rules which apply as of the balance-sheet date provides for various approaches for each risk category for the computation of required equity. VP Bank uses the standard approach for credit and market risks and the basis indicator approach for operational risks.
As of 31 December 2016, the business activities of VP Bank Group required equity totalling CHF 450.3 million (prior year: CHF 485.0 million). This represents 13 per cent of the eligible assets of CHF 3,464.0 million (prior year: CHF 3,731.1 million). The excess of equity (based upon a requirement of 13.0 per cent) as at 31.12.2016 amounted to CHF 488.2 million (prior year: CHF 426.2 million). The tier 1 ratio of 27.1 per cent (prior year: 24.4 per cent) reflects the on-going extremely robust equity situation of VP Bank. In 2016, VP Bank Group used no hybrid capital under eligible equity and, in accordance with International Financial Reporting Standards (IFRS), had netted no assets against liabilities (balance-sheet reduction).
The following table shows the capital-adequacy situation of the Group as of 31 December 2016.
Capital-adequacy computation (Basel III)
in CHF 1,000 | 31.12.2016 | 31.12.2015 |
|---|---|---|
Core capital |
|
|
Paid-in capital | 66,154 | 66,154 |
Disclosed reserves | 877,987 | 849,232 |
Group net income | 57,986 | 64,056 |
Deduction for treasury shares | –52,466 | –50,499 |
Deduction for dividends as per proposal of Board of Directors | –29,769 | –26,462 |
Deduction for goodwill and intangible assets | –36,454 | –41,083 |
Other adjustments | 55,099 | 49,806 |
Eligible core capital (tier 1) | 938,537 | 911,204 |
Eligible core capital (adjusted) | 938,537 | 911,204 |
Credit risk (in accordance with Liechtenstein standard approach) | 347,965 | 389,288 |
thereof price risk regarding equity securities in the banking book | 8,760 | 9,643 |
Market risk (in accordance with Liechtenstein standard approach) | 28,345 | 25,591 |
Operational risk (in accordance with basic indicator approach) | 72,880 | 69,067 |
Credit Value Adjustment (CVA) | 1,131 | 1,102 |
Total required equity | 450,321 | 485,048 |
|
|
|
CET1 equity ratio | 27.1% | 24.4% |
Tier 1 ratio | 27.1% | 24.4% |
Overall equity ratio | 27.1% | 24.4% |
|
|
|
Total risk-weighted assets | 3,464,005 | 3,731,142 |
|
|
|
Return on investment (net income / average balance sheet total) | 0.5% | 0.5% |
5. Financial risks
Whilst complying with the relevant legal and regulatory provisions, the monitoring and daily steering of financial risks is based upon internal bank target measures and limits relating to volumes and sensitivities. In addition, scenario analyses and stress tests demonstrate the effect of events which were not or not sufficiently taken into consideration within the scope of ordinary risk evaluation.
The unit Group Treasury & Execution with its already mentioned areas of duty is responsible for the centralised management of financial risks within the limits laid down. Group Executive Management distributes the value-at-risk (VaR) limit for financial risks, as set by the Board of Directors, over the individual Group companies and risk categories, within which the individual companies manage the risks under their own responsibility. The unit Group Risk monitors observance of the limits throughout the Group.
Market risks
Market risks arise as a result of positions being entered into in debt securities, equity shares and other securities under financial investments, foreign currencies, precious metals and in related derivatives, arising both from activities for clients as well as for Group companies whose functional currency is denominated in a foreign currency.
The Bank employs a comprehensive set of methods and indicators for the monitoring and management of market risks. In this respect, the value-at-risk approach has established itself as the standard method to measure general market risk. The value-at-risk for market risks quantifies the negative deviation, expressed in Swiss francs, from the value of all positions exposed to market risk as of the date of the evaluation. The value-at-risk indicator is computed on a Group-wide basis with the aid of historic simulation. In this process, the historical movements in market data over a period of at least five years are read in order to measure all positions subject to market risk. The projected loss is valid for a holding period of one year and will not be exceeded with a probability of 99 per cent. To compute the value-at-risk for interest-rate risk, fixed interest-bearing positions are mapped with the interest lock-up period and variable interest positions using an internal replication model.
The market risk value-at-risk of VP Bank Group at 31 December 2016 amounted to CHF 119.0 million. In the prior year, the calculation is based upon a holding period of one month so that the corresponding figure of CHF 58.5 million as of 31 December 2015 cannot be compared directly. The increase is to be ascribed, primarily , to the change in the manner of calculation.
The following table shows the value-at-risk (on a monthly basis) analysed by types of risk and the market value-at-risk computed over all risk categories. The computation of the average, highest, lowest and aggregate values is based on a separate year-on-year perspective; the total value does not therefore equate to the sum of the respective individual values by risk type.
Value-at-Risk (value at end of month)
in CHF million | Total | Interest- | Equity | Currency |
|---|---|---|---|---|
2016 |
|
|
|
|
Year-end | 119.0 | 65.8 | 17.6 | 35.7 |
Average | 121.0 | 67.2 | 17.6 | 36.2 |
Highest value | 125.9 | 70.3 | 19.7 | 38.5 |
Lowest Value | 112.4 | 64.3 | 15.9 | 31.7 |
|
|
|
|
|
2015 |
|
|
|
|
Year-end | 58.5 | 26.4 | 6.8 | 25.2 |
Average | 49.9 | 20.6 | 6.7 | 22.7 |
Highest value | 58.5 | 26.4 | 7.8 | 26.2 |
Lowest Value | 43.7 | 17.9 | 5.8 | 19.2 |
As the maximum losses arising from extreme market situations cannot be determined with the value-at-risk approach, the market risk analysis is supplemented by stress tests. Such tests render possible an estimate of the effects on the net present value of equity of extreme market fluctuations in the risk factors. In this manner, the fluctuations in net present value of all balance-sheet positions in the area of market risks are computed with the aid of sensitivity indicators on the basis of synthetically produced market movements (parallel shift, rotation or inclination changes in interest-rate curves, exchange-rate fluctuations by a multiple of their implicit volatility, slump in equity share prices).
Key rate duration profile per 100 basis increase
The following table exemplifies the results of the key rate duration process. First, the present values of all asset and liability positions as well as derivative financial instruments are determined. Subsequently, the interest rates of the relevant interest-rate curves in each maturity band and per currency are increased by one per cent (+100 basis points). The respective movements represent the gain or loss of the present value resulting from the shift in the interest-rate curve. Negative values point to an excess of assets, positive values to an excess of liabilities in the maturity band.
in CHF 1,000 | within | 1 to 3 | 3 to 12 | 1 to 5 | over | Total |
|---|---|---|---|---|---|---|
31.12.2016 |
|
|
|
|
|
|
CHF | 1,314 | 2,145 | 984 | –25,515 | –14,132 | –35,204 |
EUR | 609 | –585 | 1,842 | –6,913 | –7,566 | –12,613 |
USD | 737 | –685 | 1,051 | –11,306 | –658 | –10,861 |
Other currencies | 90 | –129 | 644 | 1,457 | 0 | 2,062 |
Total | 2,750 | 746 | 4,521 | –42,277 | –22,356 | –56,616 |
|
|
|
|
|
|
|
31.12.2015 |
|
|
|
|
|
|
CHF | 1,196 | 1,843 | 2,126 | –24,006 | –18,928 | –37,769 |
EUR | 591 | –752 | 2,335 | –6,442 | –5,357 | –9,625 |
USD | 832 | –768 | 1,854 | –13,191 | –612 | –11,885 |
Other currencies | 61 | –36 | 520 | 1,435 | 0 | 1,980 |
Total | 2,680 | 287 | 6,835 | –42,204 | –24,897 | –57,299 |
Movements in significant foreign currencies
In the following table the effects of a negative movement in the principal currencies on consolidated net income and shareholders’ equity are set out. The implicit volatility as of 31 December 2016 and 2015, respectively, is responsible for the underlying fluctuation of the Swiss franc against the Euro and the US dollar.
Currency | Variance | Effect on | Effect on |
|---|---|---|---|
2016 |
|
|
|
EUR | –8 | –3,057 | 0 |
USD | –10 | –9,401 | –9,621 |
|
|
|
|
2015 |
|
|
|
EUR | –8 | –2,897 | 0 |
USD | –10 | –7,665 | –8,595 |
The impact of a possible downturn in equity markets of 10, 20 and 30 per cent, respectively, on consolidated net income and equity is illustrated by the following table.
Movement in relevant equity share markets
Variance | Effect on | Effect on |
|---|---|---|
2016 |
|
|
–10% | –6,020 | –1,224 |
–20% | –12,039 | –2,447 |
–30% | –18,059 | –3,671 |
|
|
|
2015 |
|
|
–10% | –6,891 | –1,446 |
–20% | –13,782 | –2,891 |
–30% | –20,673 | –4,337 |
For daily risk management purposes, derivative financial instruments are entered into exclusively in the banking book and serve to hedge equity price, interest-rate and currency risks as well as to manage the banking book. The derivatives approved for this purpose are laid down in the Risk Policy.
VP Bank refinances its medium- and long-term client loans primarily with short-term client deposits and thus is subject to an interest-rate risk. Rising interest rates have an adverse impact on the net present value of interest-bearing credits and increase refinancing costs. As part of its asset & liability management, mostly interest-rate swaps measured at fair value are deployed to hedge this risk. VP Bank applies fair-value hedge accounting under IFRS in order to record in the balance sheet the contra effect of changes in value of the hedged credit transactions. For this, a portion of the underlying transactions (fixed-interest credits) are linked to the hedging transactions (payer swaps) in hedging relationships. In the event of fair-value changes relating to interest-rate movements, the carrying value of the underlying transactions concerned are adjusted in the event of movements in fair values provoked by interest-rate changes and the gains/losses taken to income.
Because the unsettled fixed-interest positions are transformed into variable interest-rate positions through the conclusion of payer swaps, a close economic relationship exists between the underlying and hedging transactions in relation to the hedged risk. Therefore, the hedging relationship between the designated amount of the underlying transactions and the designated amount of the hedging instruments (hedge ratio) is set on a one-to-one basis. A hedging relationship is efficient and effective whenever the movements in the value of the underlying and hedging transactions which are induced by interest-rate changes offset each other. Ineffectiveness is a result primarily of deviations in duration e.g. as a result of differing interest rates, timing of interest payments or differing maturities.
The initial efficiency of a hedging relationship is proven with a prospective effectiveness test. In addition, future changes in the fair value of the underlying and hedging transactions are simulated based upon scenarios and subjected to a regression analysis. Effectiveness is assessed on the basis of the analysis results. Repeated reviews take place during the duration of the hedging relationship.
VP Bank has hedged its own financial investments against currency fluctuations in the main currencies through the conclusion of foreign-currency forward contracts. In principle, no currency risks should arise from client activities; residual unsettled foreign-currency positions are closed out over the foreign-currency spot market. Group Trading & Execution is responsible for the management of foreign-currency risks arising from client activities.
Liquidity risks
Liquidity risks may arise through contractual mismatches between the in- and outflows of liquidity in the individual maturity bands. Any differences arising demonstrate how much liquidity the bank must eventually procure in each maturity band should there be an outflow of all volumes at the earliest possible time. Furthermore, concentrations of refinancing may lead to a liquidity risk if they are so great that a massive withdrawal of the related funds could trigger liquidity problems.
Liquidity risks are monitored and managed using internal targets and limits for interbank and client-related activities – whilst complying with the legal liquidity standards and provisions regarding risk concentrations on the assets’ and liabilities’ side.
As part of the introduction of the Basel III rules in Liechtenstein, the Liquidity Coverage Ratio (LCR) has been computed since the end of June 2015 and reported to the Financial Market Authority (FMA). Since the end of 2016, a lower limit of 70 per cent for the LCR applies on a European level which will be gradually be raised to 100 per cent by 2019. At the end of 2016, VP Bank presents a comfortable liquidity situation with a value for the LCR of 110 per cent.
The guidelines regarding the Net Stable Funding Ratio (NSFR) are not yet available as of the end of 2016 so that no value can yet be computed.
In the area of short-term maturities, the Bank refinances itself to a significant extent using sight balances from clients. The following table shows the maturity structure of the liabilities according to maturity bands. The cash flows (non-discounted capital and interest payments) as of 31 December 2016 and 2015 may be analysed as follows:
Cash flows on the liabilities' side
in CHF 1,000 | At sight | Cancellable | Maturing | Maturing | Maturing | Maturing | Total |
|---|---|---|---|---|---|---|---|
31.12.2016 |
|
|
|
|
|
|
|
Due to banks | 306,951 |
| 50,892 |
|
|
| 357,843 |
Due to customers – savings and deposits |
| 705,223 |
|
|
|
| 705,223 |
Due to customers – other liabilities | 7,538,006 | 853,562 | 627,184 | 106,343 | 10,000 |
| 9,135,095 |
Derivative financial instruments | 57,178 |
|
|
|
|
| 57,178 |
Securitised liabilities |
|
| 28,701 | 51,491 | 245,495 | 106,421 | 432,108 |
Total | 7,902,135 | 1,558,785 | 706,777 | 157,834 | 255,495 | 106,421 | 10,687,447 |
|
|
|
|
|
|
|
|
31.12.2015 |
|
|
|
|
|
|
|
Due to banks | 100,156 |
|
|
|
|
| 100,156 |
Due to customers – savings and deposits |
| 757,294 |
|
|
|
| 757,294 |
Due to customers – other liabilities | 8,633,137 | 637,706 | 344,422 | 67,529 | 107,318 |
| 9,790,112 |
Derivative financial instruments | 53,235 |
|
|
|
|
| 53,235 |
Securitised liabilities |
|
| 9,246 | 219,387 | 144,878 | 209,920 | 583,431 |
Total | 8,786,528 | 1,395,000 | 353,668 | 286,916 | 252,196 | 209,920 | 11,284,228 |
VP Bank can rapidly procure liquidity on a secured basis in case of need through its access to the Eurex repo market. The risk of an extraordinary, nevertheless plausible event which will take place with a very small degree of probability can be measured with the aid of stress tests. In this manner, VP Bank can take all applicable remedial action on a timely basis and, where necessary, set limits.
Credit risks
Credit risks arise from all transactions for which payment obligations of third parties in favour of the bank exist or can arise. Credit risks accrue to VP Bank from client lending activities, the money-market business including bank guarantees, correspondent and metal accounts, the reverse repo business, the Bank’s own investments in securities, securities lending and borrowing, collateral management as well as OTC derivative trades.
As of 31 December 2016, total credit exposures amounted to CHF 8.0 billion (31 December 2015: CHF 9.1 billion). The following table shows the composition thereof by on- and off-balance sheet positions.
Credit exposures
in CHF 1,000 | 31.12.2016 | 31.12.2015 |
|---|---|---|
On-balance-sheet assets |
|
|
Receivables arising from money market papers | 15,248 | 14,652 |
Due from banks | 660,760 | 2,060,270 |
Due from customers | 5,248,209 | 5,006,508 |
Public-law enterprises | 508 | 501 |
Trading portfolios |
|
|
Derivative financial instruments | 43,699 | 36,883 |
Financial instruments at fair value | 207,702 | 316,421 |
Financial instruments measured at amortised cost | 1,823,882 | 1,665,607 |
Total | 8,000,008 | 9,100,841 |
|
|
|
Off-balance-sheet transactions |
|
|
Contingent liabilities | 114,630 | 60,521 |
Irrevocable facilities granted | 45,426 | 47,922 |
Total | 160,056 | 108,443 |
Credit exposures by counterparty
in CHF 1,000 | Central | Banks | Other | Corporates | Privat | Other | Total |
|---|---|---|---|---|---|---|---|
On-balance-sheet assets as of 31.12.2016 |
|
|
|
|
|
|
|
Receivables arising from money market papers | 15,248 |
|
|
|
|
| 15,248 |
Due from banks |
| 660,612 | 148 |
|
|
| 660,760 |
Due from customers |
| 15,353 | 39,536 | 1,901,550 | 3,291,769 |
| 5,248,209 |
Public-law enterprises |
|
| 508 |
|
|
| 508 |
Trading portfolios |
|
|
|
|
|
| 0 |
Derivative financial instruments |
| 12,405 | 5,252 | 2,003 | 5,281 | 18,758 | 43,699 |
Financial instruments at fair value | 13,826 | 89,522 | 60,178 | 44,165 |
| 12 | 207,702 |
Financial instruments measured at amortised cost | 641,192 | 444,546 | 292,644 | 438,196 |
| 7,304 | 1,823,882 |
Total | 670,266 | 1,222,439 | 398,267 | 2,385,913 | 3,297,051 | 26,073 | 8,000,008 |
|
|
|
|
|
|
|
|
Off-balance-sheet transactions as of 31.12.2016 |
|
|
|
|
|
|
|
Contingent liabilities |
| 63,251 |
| 23,499 | 12,083 | 15,797 | 114,630 |
Irrevocable facilities granted |
|
| 1,664 | 23,631 | 20,131 |
| 45,426 |
Total | 0 | 63,251 | 1,664 | 47,130 | 32,214 | 15,797 | 160,056 |
On-balance-sheet assets as of 31.12.2015 |
|
|
|
|
|
|
|
Receivables arising from money market papers | 14,652 |
|
|
|
|
| 14,652 |
Due from banks |
| 2,060,121 | 148 |
|
|
| 2,060,270 |
Due from customers |
| 12,718 | 1,844 | 1,608,750 | 3,383,177 | 19 | 5,006,508 |
Public-law enterprises |
|
| 501 |
|
|
| 501 |
Trading portfolios |
|
|
|
|
|
| 0 |
Derivative financial instruments |
| 17,719 | 227 | 5,196 | 2,646 | 11,095 | 36,883 |
Financial instruments at fair value | 12,134 | 166,539 | 75,365 | 62,371 |
| 12 | 316,421 |
Financial instruments measured at amortised cost | 652,470 | 412,122 | 267,586 | 325,980 |
| 7,448 | 1,665,607 |
Total | 679,257 | 2,669,220 | 345,670 | 2,002,298 | 3,385,823 | 18,574 | 9,100,841 |
|
|
|
|
|
|
|
|
Off-balance-sheet transactions as of 31.12.2015 |
|
|
|
|
|
|
|
Contingent liabilities |
| 48 | 29 | 17,211 | 16,692 | 26,541 | 60,521 |
Irrevocable facilities granted |
|
| 1,721 |
| 29,315 | 16,886 | 47,922 |
Total | 0 | 48 | 1,750 | 17,211 | 46,006 | 43,427 | 108,443 |
Credit exposures by collateral
in CHF 1,000 | Secured by recognised | Not secured by recognised | Total |
|---|---|---|---|
On-balance-sheet assets as of 31.12.2016 |
|
|
|
Receivables arising from money market papers |
| 15,248 | 15,248 |
Due from banks | 1,256 | 659,504 | 660,760 |
Due from customers | 4,908,808 | 339,401 | 5,248,209 |
Public-law enterprises |
| 508 | 508 |
Trading portfolios |
|
| 0 |
Derivative financial instruments | 23,150 | 20,549 | 43,699 |
Financial instruments at fair value |
| 207,702 | 207,702 |
Financial instruments measured at amortised cost |
| 1,823,882 | 1,823,882 |
Total | 4,933,213 | 3,066,795 | 8,000,008 |
|
|
|
|
Off-balance-sheet transactions as of 31.12.2016 |
|
|
|
Contingent liabilities | 65,027 | 49,603 | 114,630 |
Irrevocable facilities granted | 9,135 | 36,292 | 45,426 |
Total | 74,161 | 85,895 | 160,056 |
On-balance-sheet assets as of 31.12.2015 |
|
|
|
Receivables arising from money market papers |
| 14,652 | 14,652 |
Due from banks | 210,210 | 1,850,060 | 2,060,270 |
Due from customers | 4,675,993 | 330,515 | 5,006,508 |
Public-law enterprises |
| 501 | 501 |
Trading portfolios |
|
| 0 |
Derivative financial instruments | 24,045 | 12,838 | 36,883 |
Financial instruments at fair value |
| 316,421 | 316,421 |
Financial instruments measured at amortised cost |
| 1,665,607 | 1,665,607 |
Total | 4,910,248 | 4,190,593 | 9,100,841 |
|
|
|
|
Off-balance-sheet transactions as of 31.12.2015 |
|
|
|
Contingent liabilities | 35,054 | 25,467 | 60,521 |
Irrevocable facilities granted | 7,121 | 40,801 | 47,922 |
Total | 42,175 | 66,268 | 108,443 |
In the case of amounts due from banks, money-market paper as well as nostro positions in interest-bearing securities, the valuation is based upon external ratings.
The following tables show the individual on- and off-balance-sheet positions according to rating classes, risk-weighting classes and country of domicile.
Credit exposures by rating classes
in CHF 1,000 | Not-value-adjusted positions | Value- | Total | |||
|---|---|---|---|---|---|---|
| Investment | Safe | Unsafe | Without | adjusted |
|
On-balance-sheet assets as of 31.12.2016 |
|
|
|
|
|
|
Receivables arising from money market papers | 15,248 |
|
|
|
| 15,248 |
Due from banks | 654,597 |
|
| 7,031 | –868 | 660,760 |
Due from customers |
|
|
| 5,310,493 | –62,284 | 5,248,209 |
Public-law enterprises |
|
|
| 508 |
| 508 |
Trading portfolios |
|
|
|
|
| 0 |
Derivative financial instruments | 11,748 |
|
| 31,951 |
| 43,699 |
Financial instruments at fair value | 205,698 |
|
| 2,004 |
| 207,702 |
Financial instruments measured at amortised cost | 1,798,871 |
|
| 25,011 |
| 1,823,882 |
Total | 2,686,162 | 0 | 0 | 5,376,999 | –63,152 | 8,000,008 |
|
|
|
|
|
|
|
Off-balance-sheet transactions as of 31.12.2016 |
|
|
|
|
|
|
Contingent liabilities |
|
|
| 114,630 |
| 114,630 |
Irrevocable facilities granted |
|
|
| 45,426 |
| 45,426 |
Total | 0 | 0 | 0 | 160,056 | 0 | 160,056 |
On-balance-sheet assets as of 31.12.2015 |
|
|
|
|
|
|
Receivables arising from money market papers | 14,652 |
|
|
|
| 14,652 |
Due from banks | 2,016,304 |
|
| 45,712 | –1,747 | 2,060,270 |
Due from customers |
|
|
| 5,067,390 | –60,882 | 5,006,508 |
Public-law enterprises |
|
|
| 501 |
| 501 |
Trading portfolios |
|
|
|
|
| 0 |
Derivative financial instruments | 19,808 |
|
| 17,075 |
| 36,883 |
Financial instruments at fair value | 313,951 |
|
| 2,470 |
| 316,421 |
Financial instruments measured at amortised cost | 1,637,006 | 1,105 |
| 27,496 |
| 1,665,607 |
Total | 4,001,722 | 1,105 | 0 | 5,160,643 | –62,629 | 9,100,841 |
|
|
|
|
|
|
|
Off-balance-sheet transactions as of 31.12.2015 |
|
|
|
|
|
|
Contingent liabilities |
|
|
| 60,521 |
| 60,521 |
Irrevocable facilities granted |
|
|
| 47,922 |
| 47,922 |
Total | 0 | 0 | 0 | 108,443 | 0 | 108,443 |
Credit exposures by risk-weighting classes1 | |||||||||
in CHF 1,000 | 0% | 10% | 20% | 35% | 50% | 75% | 100% | 150% | Total |
|---|---|---|---|---|---|---|---|---|---|
On-balance-sheet assets as of 31.12.2016 |
|
|
|
|
|
|
|
|
|
Receivables arising from money market papers | 15,248 |
|
|
|
|
|
|
| 15,248 |
Due from banks | 207,235 |
| 453,492 |
| 33 |
|
|
| 660,760 |
Due from customers | 1,687,830 |
| 6,711 | 1,997,297 | 952,280 | 13,739 | 568,714 | 22,146 | 5,248,717 |
Derivative financial instruments | 23,833 |
| 11,453 |
| 365 | 544 | 7,503 |
| 43,699 |
Financial instruments | 1,190,409 |
| 478,644 |
| 295,053 |
| 67,478 |
| 2,031,584 |
Other assets | 6,048 |
| 2,369 | 410 | 7,243 | 99 | 69,077 |
| 85,246 |
Total | 3,130,603 | 0 | 952,669 | 1,997,706 | 1,254,975 | 14,383 | 712,773 | 22,146 | 8,085,255 |
|
|
|
|
|
|
|
|
|
|
Off-balance-sheet transactions as of 31.12.2016 |
|
|
|
|
|
|
|
|
|
Contingent liabilities | 27,186 |
| 34 | 80 | 35,081 | 386 | 51,863 |
| 114,630 |
Irrevocable facilities granted |
|
| 1,664 |
|
|
| 43,762 |
| 45,426 |
Total | 27,186 | 0 | 1,698 | 80 | 35,081 | 386 | 95,625 | 0 | 160,056 |
|
|
|
|
|
|
|
|
|
|
On-balance-sheet assets as of 31.12.2015 |
|
|
|
|
|
|
|
|
|
Receivables arising from money market papers | 14,652 |
|
|
|
|
|
|
| 14,652 |
Due from banks | 210,358 |
| 1,573,051 |
| 276,861 |
|
|
| 2,060,270 |
Due from customers | 1,212,549 |
| 252,912 | 1,975,614 | 890,056 | 78,526 | 584,797 | 12,556 | 5,007,009 |
Derivative financial instruments | 14,915 |
| 17,628 | 2,022 | 91 | 109 | 2,119 |
| 36,883 |
Financial instruments | 818,798 |
| 867,189 |
| 262,047 |
| 33,994 |
| 1,982,028 |
Other assets | 5,604 |
| 7,961 | 189 | 9,378 | 191 | 38,533 |
| 61,856 |
Total | 2,276,876 | 0 | 2,718,741 | 1,977,826 | 1,438,432 | 78,825 | 659,442 | 12,556 | 9,162,698 |
|
|
|
|
|
|
|
|
|
|
Off-balance-sheet transactions as of 31.12.2015 |
|
|
|
|
|
|
|
|
|
Contingent liabilities | 42,177 |
| 100 | 211 | 73 | 1,019 | 16,941 |
| 60,521 |
Irrevocable facilities granted |
|
| 1,721 |
|
| 549 | 45,652 |
| 47,922 |
Total | 42,177 | 0 | 1,821 | 211 | 73 | 1,568 | 62,593 | 0 | 108,443 |
- In contrast to the remaining tables in the section on credit risks, the tables regarding credit exposures by risk-weighting classes include other assets, not, however, trading portfolios.
Credit exposures by country of domicile
in CHF 1,000 | Liechten- | Europe | North | South | Asia | Other | Total |
|---|---|---|---|---|---|---|---|
On-balance-sheet assets as of 31.12.2016 |
|
|
|
|
|
|
|
Receivables arising from money market papers |
|
|
|
| 15,248 |
| 15,248 |
Due from banks | 525,849 | 125,117 | 5,087 | 139 | 3,181 | 1,387 | 660,760 |
Due from customers | 3,632,390 | 654,275 | 68,712 | 3,713 | 387,695 | 501,424 | 5,248,209 |
Public-law enterprises |
|
|
|
|
| 508 | 508 |
Trading portfolios |
|
|
|
|
|
| 0 |
Derivative financial instruments | 28,063 | 13,180 | 448 | 89 | 91 | 1,829 | 43,699 |
Financial instruments |
| 167,280 | 21,582 |
| 8,637 | 10,203 | 207,702 |
Financial instruments measured | 143,635 | 823,238 | 758,426 | 13,015 | 45,035 | 40,533 | 1,823,882 |
Total | 4,329,935 | 1,783,090 | 854,255 | 16,956 | 459,887 | 555,884 | 8,000,008 |
|
|
|
|
|
|
|
|
Off-balance-sheet transactions as of 31.12.2016 |
|
|
|
|
|
|
|
Contingent liabilities | 72,079 | 23,931 | 1,216 | 1,149 | 2,494 | 13,761 | 114,630 |
Irrevocable facilities granted | 17,706 |
| 155 |
| 78 | 27,487 | 45,426 |
Total | 89,786 | 23,931 | 1,371 | 1,149 | 2,572 | 41,248 | 160,056 |
On-balance-sheet assets as of 31.12.2015 |
|
|
|
|
|
|
|
Receivables arising from money market papers |
|
|
|
| 14,652 |
| 14,652 |
Due from banks | 982,804 | 930,309 | 81,922 | 50,232 | 3,115 | 11,887 | 2,060,270 |
Due from customers | 3,535,911 | 529,667 | 152,432 | 35,320 | 184,534 | 568,644 | 5,006,508 |
Public-law enterprises |
|
|
|
|
| 501 | 501 |
Trading portfolios |
|
|
|
|
|
| 0 |
Derivative financial instruments | 25,545 | 7,090 | 625 | 107 | 259 | 3,258 | 36,883 |
Financial instruments |
| 228,230 | 41,477 | 2,538 | 15,294 | 28,883 | 316,421 |
Financial instruments measured | 84,279 | 785,480 | 679,363 | 21,518 | 44,331 | 50,636 | 1,665,607 |
Total | 4,628,539 | 2,480,777 | 955,819 | 109,714 | 262,184 | 663,808 | 9,100,841 |
|
|
|
|
|
|
|
|
Off-balance-sheet transactions as of 31.12.2015 |
|
|
|
|
|
|
|
Contingent liabilities | 14,981 | 20,629 | 278 | 2,739 | 2,167 | 19,728 | 60,521 |
Irrevocable facilities granted | 20,116 |
| 86 |
| 76 | 27,643 | 47,922 |
Total | 35,097 | 20,629 | 364 | 2,739 | 2,243 | 47,371 | 108,443 |
Within the scope of the client lending business, credits are granted on a regional and international basis to private and commercial clients whereby the focus is on the private client business with CHF 3.3 billion of mortgage credits (31 December 2015: CHF 3.4 billion). From a regional perspective, VP Bank conducts the lion’s share of this business in the Principality of Liechtenstein and on the Eastern part of Switzerland. Given the broad diversification of exposures, there are no risk concentrations by industry or segment.
The ten largest single exposures encompass 13 per cent of total credit exposures (31 December 2015: 16 per cent). Exposures to banks relate exclusively to institutions with a high credit capacity (investment grade rating) and a registered office in an OECD country (excluding GIIPS countries).
In addition to the Risk Policy, the Business Rules on Credit constitute the binding framework regulating client lending activities. Set out therein are not only the general guidelines governing credit granting as well as the framework conditions for the conclusion of all types of credit business; they also designate those can take valid decisions and the corresponding bandwidths within the framework of which credits may be approved (powers of authority).
With only few exceptions in the area of private and commercial clients, client lending exposures must be covered by the collateral value of the security (collateral less a deduction for risk). Counterparty risks in the loan business are governed by limits which restrict the amount of exposure depending on credit-worthiness, industry segment, collateral and risk domicile of the client. VP Bank employs an internal rating procedure to evaluate credit-worthiness. Deviations from credit-granting principles (exceptions to policy) are dealt with as part of the credit-risk management process depending on the risk content.
VP Bank enters into both secured and unsecured positions in the interbank business. Unsecured positions result from money-market activities (incl. bank guarantees, correspondent and metal accounts), secured positions arising from the reverse repo business, securities & lending activities, collateral management as well as OTC derivative transactions. As repo deposits are fully secured and the collateral received serves as a reliable source of liquidity in a crisis situation, not only counterparty but also liquidity risk is reduced.
Counterparty risks in the interbank business may only be entered into in approved countries and with approved counterparties. A comprehensive system of limits contains the level of exposure depending on the duration, rating, risk domicile and collateral of the counterparty. In this connection, VP Bank uses for banks the ratings of the two rating agencies, Standard & Poor's and Moody’s. OTC derivative transactions may only be concluded with counterparties with whom a netting contract has been agreed.
Credit risks are managed and monitored not only on an individual client level but also on a portfolio level. At the portfolio level, VP Bank uses the expected and unexpected credit loss to monitor and measure credit risk. The expected credit loss calculates – on the basis of historical loss data and estimated default probabilities – the loss per credit portfolio which may be anticipated within a year. In addition, the results of the analysis flow into the calculation of the general lump-sum valuation allowances in the annual financial statements. The unexpected credit loss values the deviation of the actual loss, expressed as the value-at-risk, from the expected loss assuming a certain probability.
During the past financial year, VP Bank has further reduced the volume of credit derivatives in its own portfolio. The following table shows the contract volume of credit derivatives by type of product.
Credit derivatives (contract volume)
in CHF 1,000 | Provider of | Provider of |
|---|---|---|
Collateralised debt obligations | 10 | 12 |
Total | 10 | 12 |
The following table shows impaired and non-performing receivables, as well as specific valuation allowances, by domicile.
Impaired, non-performing and valuation-adjusted credit exposures by country of domicile
in CHF 1,000 | Impaired receivables | Overdue receivables | Individual value |
|---|---|---|---|
31.12.2016 |
|
|
|
Liechtenstein and Switzerland | 49,598 | 13,350 | 16,929 |
Europe | 12,694 | 11,611 | 11,382 |
North America |
| 1,084 |
|
South America | 87 | 87 | 87 |
Asia |
|
|
|
Other | 8,760 | 19,069 | 8,136 |
Total | 71,140 | 45,201 | 36,535 |
|
|
|
|
31.12.2015 |
|
|
|
Liechtenstein and Switzerland | 51,894 | 8,828 | 18,023 |
Europe | 15,363 | 10,707 | 11,733 |
North America | 21 |
| 21 |
South America | 142 | 123 | 129 |
Asia |
|
|
|
Other | 9,364 | 5 | 8,331 |
Total | 76,784 | 19,663 | 38,238 |
Non-interest-bearing receivables according to remaining duration
in CHF 1,000 | Due within | Due within | Due within | Due after | Total |
|---|---|---|---|---|---|
Total, 2016 reporting period | 45,201 |
|
|
| 45,201 |
Total, 2015 reporting period | 19,663 |
|
|
| 19,663 |
Country risk
Country risks arise whenever political or economic conditions specific to a country impinge on the value of an exposure abroad.
The monitoring and management of country risks is undertaken using volume limits which restrict the respective aggregate exposures per country rating (Standard & Poor’s and Moody’s). All on- and off-balance sheet receivables are considered in this process; positions in the Principality of Liechtenstein and Switzerland do not fall under this country limit rule. The risk domicile of an exposure is the basis for recognising country risk. In the case of secured exposures, in principle the country in which the collateral is located is considered.
The following table shows the distribution of credit exposures by country rating. Non-rated positions are mostly exposures from local business activities (receivables secured by mortgage) of VP Bank (BVI) Ltd.
Country exposures according to rating
in % | 31.12.2016 | 31.12.2015 |
|---|---|---|
AAA | 90.1 | 93.0 |
AA | 7.3 | 3.7 |
A | 0.6 | 1.0 |
BBB - B | 0.6 | 0.7 |
CCC - C | 0.0 | 0.1 |
Not Rated | 1.4 | 1.5 |
Total | 100.0 | 100.0 |
As regards the country risk of Russia and Ukraine, VP Bank has no noteworthy risk-domicile exposures in these countries.
Financial instruments in GIIPS countries
in CHF 1,000 | Valued at | Valued at | Total | Total |
|---|---|---|---|---|
Greece |
|
|
|
|
Ireland1 |
|
|
| 2,018 |
Italy |
|
|
|
|
Portugal |
|
|
|
|
Spain |
|
|
|
|
Total | 0 | 0 | 0 | 2,018 |
- As of 31.12.2015, the holdings of debenture included one debenture maturing in April 2016 which was guaranteed by the parent company in the USA.
6. Operational risks
The causes for operational risks are multiple. People make mistakes, IT systems fail or business processes are inoperative. Therefore, it is necessary to detect the events which trigger important risk events and to determine their impact in order to contain them with suitable preventive measures.
The management of operational risks is understood in VP Bank to be an integral cross-divisional function which is to be implemented on a uniform Group-wide basis over all business units and processes.
Each person in a management position is responsible for the identification and evaluation of operational risks as well as for the definition and performance of key controls and measures to contain risks. This responsibility may not be delegated. Each person in a management position shall make a critical annual assessment of whether the key controls have on-going validity and whether key controls are missing. Each management member in levels 1 and 2 shall undertake an annual self-assessment of that part of the internal control system for which he is responsible. The results of this self-analysis are communicated annually to the central unit Group Risk.
Within the scope of their powers of authority, these make available, on a Group-wide basis, the instruments for a systematic management of operational risks and ensures their on-going development. These include the conduct of risk assessments (scenario analyses) as part of risk identification and evaluation, the performance of key controls, the maintenance of a data bank of incidents as well as the deployment of early warning indicators.
Risk consciousness could be reinforced at all levels as a result of intense co-operation amongst specialist departments to further develop the complete system of management of operational risks. In this connection, a catalogue of key controls was further developed. Knowledge and experience was exchanged within the Group in order to ensure a coordinated approach. Thanks to a uniform implementation of the project, it is possible to provide the relevant target groups (Board of Directors, Group Executive Management and Senior Management) with a meaningful quarterly status report on operational risks within VP Bank Group.
Business Continuity Management (BCM), as a further important sub-area, is systematically pursued by VP Bank with expert and specialised knowledge along the lines of ISO standard 22301:2012. The basis thereof is the BCM strategy which is successively implemented by Group Executive Management and reviewed on an on-going basis for compliance and accuracy. Operationally critical processes are reviewed in detail, discussed and, where necessary, documented with a clear course of action whenever risks crystallise. The organisation necessary for crisis management is established and its members routinely trained and instructed.
7. Business risks
Business risks are the object of a qualitative management process within VP Bank. Within the scope of the ordinary strategy process, business risks are identified by Group Executive Management and taken account of in an appropriate manner. In view of the multi-faceted nature of the effects which can impact the future development of the business and the profitability of the bank, potential business risks and their probability of occurrence and effects thereof are discussed on the basis of scenarios and appropriate measures decided upon to contain the risks. The results serve as a basis for the strategic planning process and thus flow into the medium-term and annual planning and budgeting process.