
Key figures of VP Bank Group
| 30.06.2016 |
| 30.06.2015 | 31.12.2015 | Variance to |
|---|---|---|---|---|---|
| unaudited |
| audited | audited | 30.06.2015 in % |
Key income statement data in CHF million1, 2 |
|
|
|
|
|
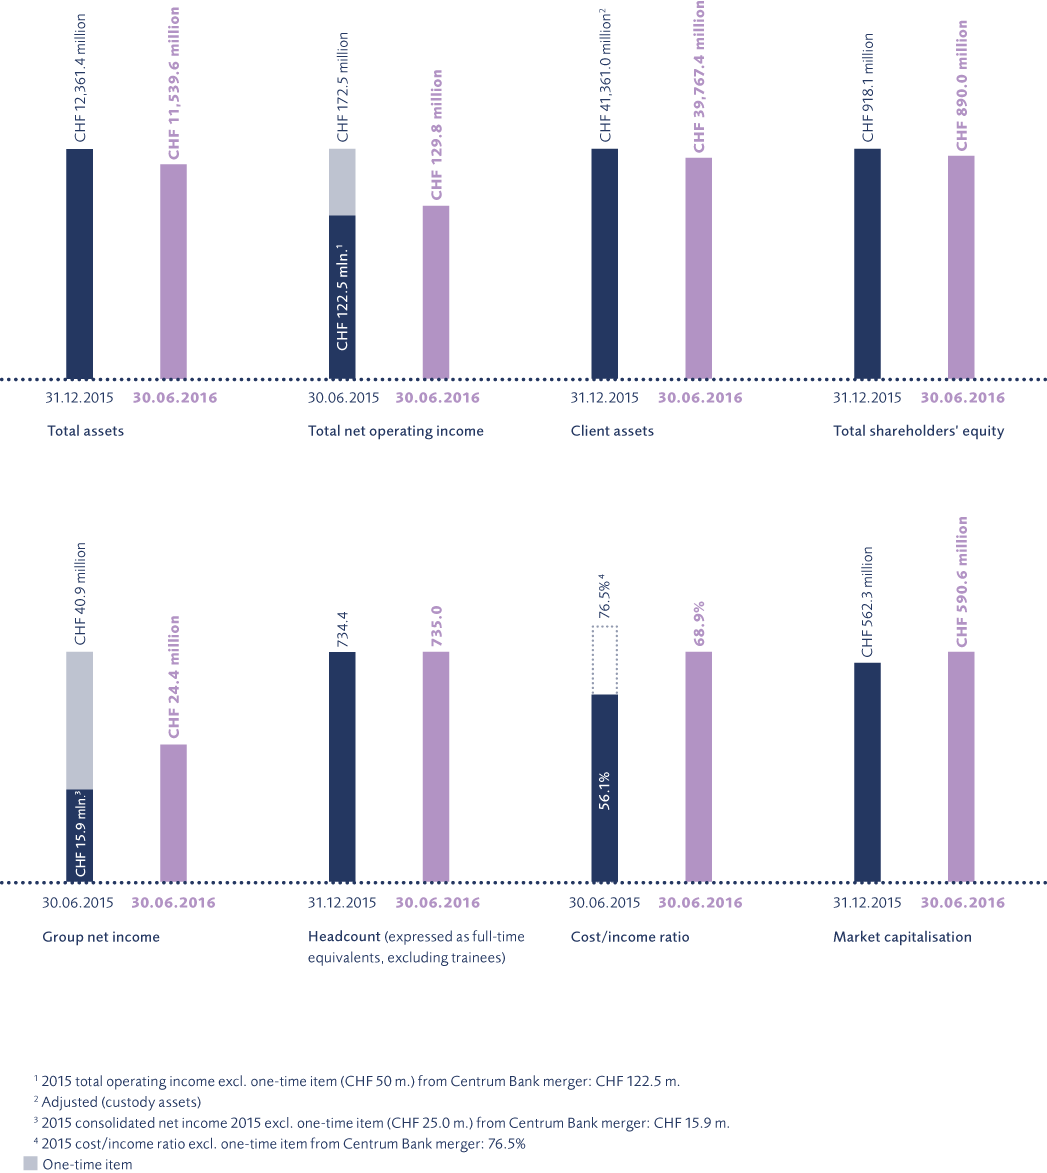
Total net operating income | 129.8 |
| 172.5 | 306.6 | –24.7 |
Total net interest income | 49.5 |
| 42.4 | 84.5 | 16.8 |
Total net income from commission business and services | 60.7 |
| 65.9 | 126.4 | –8.0 |
Income from trading activities | 17.7 |
| 19.0 | 46.1 | –7.0 |
Operating expenses | 89.4 |
| 96.8 | 182.1 | –7.6 |
Group net income | 24.4 |
| 40.9 | 64.1 | –40.4 |
|
|
|
|
|
|
| 30.06.2016 |
| 30.06.2015 | 31.12.2015 | Variance to |
| unaudited |
| audited | audited | 31.12.2015 in % |
Key balance-sheet data in CHF million1, 2 |
|
|
|
|
|
Total assets | 11,539.6 |
| 12,623.1 | 12,361.4 | –6.6 |
Due from banks | 1,154.2 |
| 3,598.8 | 2,060.3 | –44.0 |
Due from customers | 5,080.6 |
| 4,921.5 | 5,007.0 | 1.5 |
Due to customers | 9,576.4 |
| 10,561.9 | 10,546.4 | –9.2 |
Total shareholders' equity | 890.0 |
| 922.3 | 918.1 | –3.1 |
Equity ratio (in %) | 7.7 |
| 7.3 | 7.4 | 3.8 |
Tier 1 ratio (in %) | 25.7 |
| 21.9 | 24.4 | 5.2 |
Leverage ratio in accordance with Basel III (in %) | 7.4 |
| n.a. | 7.0 | 5.7 |
|
|
|
|
|
|
Client assets in CHF billion2, 8 | 39,767.4 |
| 40,698.0 | 41,361.0 | –3.9 |
On-balance-sheet customer deposits (excluding custody assets) | 9,380.3 |
| 10,220.4 | 10,062.1 | –6.8 |
Fiduciary deposits (excluding custody assets) | 555.8 |
| 535.7 | 512.7 | 8.4 |
Client securities accounts | 24,104.0 |
| 23,826.3 | 24,193.8 | –0.4 |
Custody assets8 | 5,727.3 |
| 6,115.7 | 6,592.3 | –13.1 |
Net new money | –218.5 |
| 6,154.8 | 6,045.5 | n.a. |
|
|
|
|
|
|
Key operating indicators2 |
|
|
|
|
|
Return on equity (in %)1, 3 | 5.5 |
| 9.2 | 7.3 |
|
Cost/income ratio (in %)4 | 68.9 |
| 56.1 | 59.4 |
|
Headcount (expressed as full-time equivalents, excluding student apprentices)5 | 735.0 |
| 746.0 | 734.4 |
|
Total net operating income per employee (in CHF 1,000) | 176.6 |
| 231.3 | 417.4 |
|
Total operating expenses per employee (in CHF 1,000) | 121.7 |
| 129.7 | 248.0 |
|
Group net income per employee (in CHF 1,000) | 33.2 |
| 54.9 | 87.2 |
|
|
|
|
|
|
|
Key indicators related to shares of VP Bank in CHF1, 9 |
|
|
|
|
|
Group net income per registered share A6 | 4.04 |
| 6.37 | 10.17 |
|
Group net income per registered share B6 | 0.40 |
| 0.64 | 1.02 |
|
Shareholders' equity per registered share A on the balance-sheet date | 147.48 |
| 139.47 | 154.01 |
|
Shareholders' equity per registered share B on the balance-sheet date | 13.74 |
| 13.95 | 14.18 |
|
Quoted price per registered share A | 89.30 |
| 81.75 | 82.00 |
|
Quoted price per registered share B | 8.90 |
| 8.18 | 8.20 |
|
Market capitalisation (in CHF million)7 | 591 |
| 541 | 542 |
|
Price/earnings ratio per registered share A | 11.04 |
| 6.09 | 8.06 |
|
Price/earnings ratio per registered share B | 11.00 |
| 6.09 | 8.06 |
|
Rating Standard & Poor's | A–/Stable/A–2 |
| A–/Negative/A–2 | A–/Negative/A–2 |
|
- The reported key data and operating indicators are computed and reported on the basis of the share of the net profit and shareholders’ equity attributable to the shareholders of VP Bank Ltd, Vaduz.
- Details in the notes to the consolidated income statement and consolidated balance sheet.
- Net income / average shareholders’ equity less dividend.
- Total operating expenses / total net operating income.
- In accordance with legal requirements, apprentices are to be included in headcount statistics as 50 per cent of equivalent full-time employees.
- Based on the weighted average number of shares (registered share A) (note 11).
- Including registered shares B.
- Adjusted (custody assets, see also note client assets).
- Conversion of bearer shares into registered shares A (note 13).